
Yeah, so I spent some time in the hospital this summer. I’m not going to get into the gory details at the moment, but suffice to say that I’ve known I had premature heart disease for some time, and on 20th July, it struck again. For the moment, I’m feeling pretty much normal. I’m on a bunch of new medication. I’m walking every day. I’ll know a lot more after 3 months out (around Hallowe’en). For now I want to focus on one aspect of the aftermath: food. And because I’m such a nerd, I have plenty of data, and charts!
We love food. The tremendous number, quality, and variety of restaurants in NYC is really one of the top perks of living here, just as the average apartment kitchen size is not! So although I enjoy cooking, particularly for special occasions, lately we had been eating dinners out almost every day.
Thanks to my obsessive use of ledger, I can compute average dining and grocery expenditures over the past several months. In the graph below, the blue line indicates restaurant expenses per day, averaged over the preceding seven days. The red line is the same computation for grocery expenses. (For any chromatically challenged readers, the blue line is the one on top, for most of the graph.) You can clearly see the inverse relationship in several places; when there is a sharp drop in restaurant expenses, there is usually a corresponding hump in grocery. (The large blue spike corresponds to a several-day getaway at the Borgata Water Club, Atlantic City.)
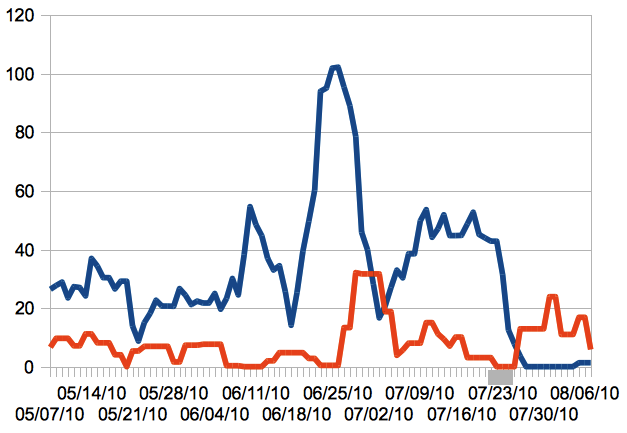

The gray rectangle on the X axis indicates the days I spent in the hospital. Something remarkable happens after that: restaurant expenses drop to nearly zero, and grocery stays somewhat high. In short, I’ve been cooking up a storm since being home! I started working through the New Mayo Clinic Cookbook, which a good friend gave me several years back. I like that it has complete nutrition facts for every recipe.
While munching on hospital food, I came to think of restaurant food as inherently unhealthy. Even if you make reasonable choices regarding cuisine and dishes – which, for the most part, I thought I did – restaurant food is always going to be saltier and fattier than what I would prepare at home. I imagine I’ll eventually find some balance, where I won’t see restaurant food as poison, but rather something to be enjoyed in strict moderation; i.e., not six nights a week.
I also started tracking my weight, and everything I consumed, using the LoseIt iPhone app. It actually doesn’t seem that hard to drop some weight just by honestly counting calories; the awareness alone helps with willpower, and seeing some results is motivating too. Below is a graph of my daily weight measurements (blue diamonds) and trend (red line) since hospital. It was produced with the Hacker’s Diet online tools. (LoseIt should incorporate the trend computation too – it’s very helpful.)
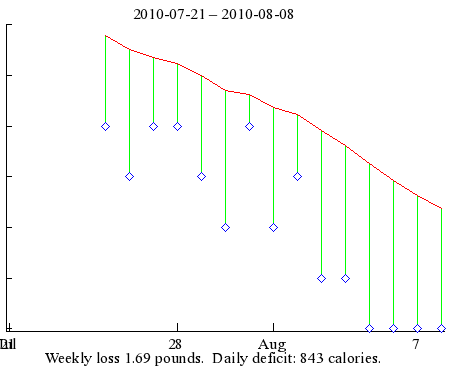
I started the trend at two pounds heavier than the first sample. That was the last measurement I took before hospital, and having the graph reflect that there had already been some loss there was more motivating! Of course, this is just the beginning. I’d like to periodically post these graphs here or on Flickr, to put the evidence of my progress out there in public.


